Skip to content


Opening a new retail store is exciting but can also feel overwhelming. Your main concern is how to merchandise a new store to maximize sales and customer engagement. This Store Merchandising Guide offers a step-by-step roadmap, from layout planning to performance measurement. You will find practical tips, industry best practices, and insights on using innovative tools. By the end, you will have a clear action plan to turn your store into a customer magnet.
According to industry data, nearly 60% of in-store buying choices are directly affected by visual merchandising. This means six out of ten shoppers are guided more by what they see and feel than by their plan.
Key Takeaways
- Place best-selling items at eye level to boost visibility and sales.
- Use automated pusher systems to keep shelves full and cut labor costs.
- Track sales per square foot to find weak areas and improve your layout.
Store Merchandising Guide: Planning Your Layout
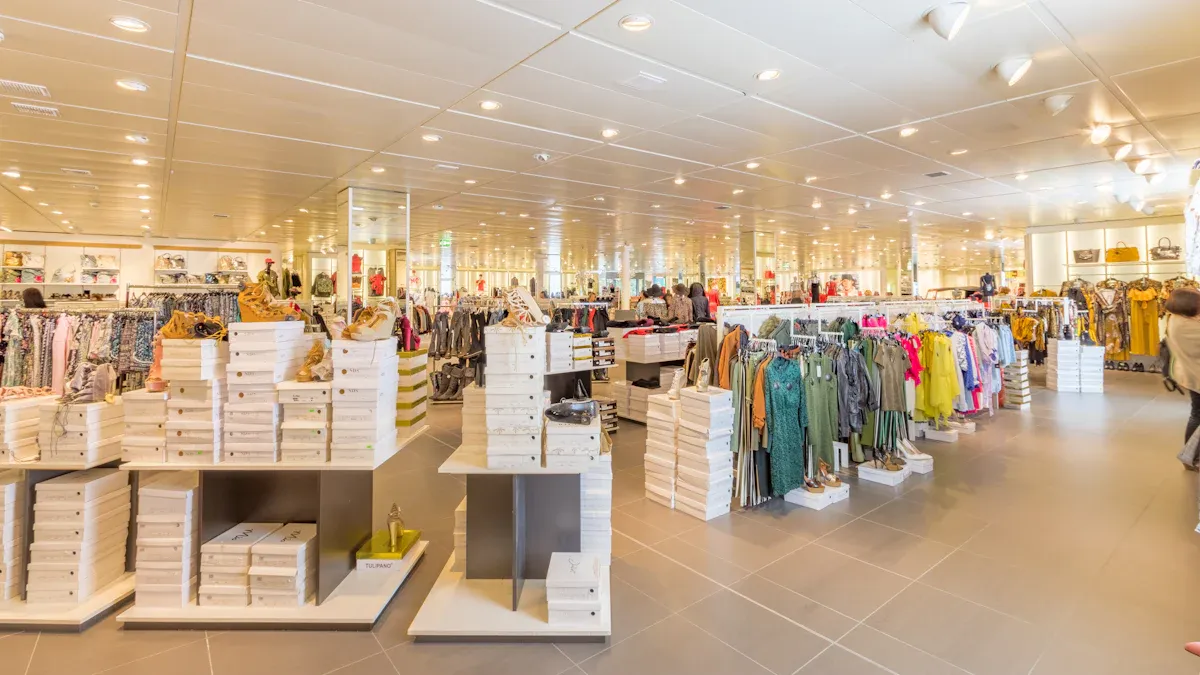
Your store layout controls how customers move, what they see, and what they buy. A good layout boosts sales and keeps shoppers happy. Bad layouts cause confusion and lower revenue. This part of the Store Merchandising Guide tells you how to pick the right layout and plan your customer’s path.
Choosing the Right Store Layout Type
Three main layout types are common in retail: grid, loop, and free-flow. Each one works best for different store types and shopping habits.
Grid layout uses straight aisles with shelves in lines. Grocery stores, drugstores, and discount stores like this design. The grid makes shoppers walk past every product category, boosting product exposure and guiding orderly browsing. Convenience products at the back pull customers through the whole store, increasing exposure to all items. End caps are free-standing displays at the ends of aisles that always get noticed and greatly boost sales of promoted items. Cross-merchandising means putting related items together, like pasta sauce next to pasta, which increases average order value. Impulse items near the checkout get extra purchases, with 27% of shoppers buying while waiting. The grid works best for routine trips where customers want efficiency.
Loop layout guides customers on a circular path around the store. Clothing stores, electronics shops, and specialty stores use this design. The loop creates a natural path that shows shoppers every department. You can put high-margin items along the main path and seasonal products near the entrance. This layout encourages browsing and discovery. It is ideal for stores where customers look around without rushing.
Free-flow layout uses uneven fixtures, racks, and displays with no clear aisles. Boutiques, gift shops, and high-end stores like this style. Free-flow creates an open, relaxed feel that invites people to look around. You can easily rearrange displays to match new stock or sales. But this layout needs careful planning to avoid crowding and keep all products visible.
Mapping the Customer Journey
After picking your layout, map the customer’s path from entry to checkout. This step finds high-traffic areas and possible bottlenecks. Companies with great omnichannel engagement have an average yearly revenue growth of 9.5%. Businesses with weaker strategies only see 3.4% average yearly revenue growth. This difference shows the money impact of knowing every customer touchpoint.
Start with qualitative methods. Do customer interviews, surveys, and observation studies to learn what shoppers want and what frustrates them. Watch how people move through your store. Note where they stop, what they skip, and where they pause.
Use quantitative tools to track browsing, time spent, and conversion trends. Analytics platforms give data on customer interactions. Use self-service kiosks and queue management systems to gather real-time info on customer preferences.
Think about Kohl’s. They used queue management technology in many stores. By watching queue lengths in real time and using customer feedback, Kohl’s changed staffing, improved checkout lanes, and gave faster, more personal service. This approach cut wait times and gave useful insights for improving the customer journey.
Sales per square foot (SPSF) is a tool to check your layout. High SPSF means you use space well and have a good layout. Low SPSF means poor merchandising, weak product lines, or bad layout. Track SPSF in different store sections to see what works and what needs changes. This metric leaves out non-selling areas like stockrooms and offices, giving you a true look at floor productivity.
Combine all data to create a full picture of the customer experience. This integration helps you find problem points at key touchpoints and improve your layout.
Visual Merchandising Techniques That Sell
Visual merchandising turns your store into a silent salesperson. It pulls in customers, sparks impulse buys, and shares your brand story without saying a word. This part of the Store Merchandising Guide shows you how to use displays, lighting, and color to build a space that sells.
Creating Impactful Window Displays
Your window display is your first handshake with a customer. It has about three seconds to stop someone walking past. Make those seconds count with a clear focal point. Place your hero product at eye level, surrounded by supporting items that tell a story. Use props to create context, but keep them minimal so the product stays the star.
Update your window regularly to reflect seasons, holidays, or new arrivals. A static window becomes invisible to repeat visitors. Change it at least every two to four weeks. When you do, photograph the display for your records. Track which windows draw people inside and which ones get ignored.
Well-designed POP pricing systems and sign holders enhance your window displays by making prices and promotions unmissable. Clear, well-placed signage reduces friction. Customers see the product, understand the value, and step inside with confidence. A price tag that is hard to read costs you sales. A crisp, visible one removes hesitation.
Using Lighting and Color to Guide Shoppers
Lighting and color work together to shape how customers feel and what they notice. Color psychology plays a powerful role in engagement. Warm hues like amber and earthy tones create a cozy atmosphere that encourages leisurely browsing. Bold, vibrant colors generate energy and make the space feel immersive. Blues and greens evoke calm and trust, while reds and yellows ignite excitement.
| Mechanism | How it increases product engagement |
|---|---|
| Atmosphere setting | Warm hues create a cozy, welcoming ambiance; bold colors create energy and invite interaction. |
| Emotional engagement | Blues/greens evoke calm and trust; reds/yellows ignite excitement, creating memorable connections. |
| Brand identity | Consistent brand colors reinforce recognition, trust, and authenticity. |
| Product emphasis | Contrasting colors act as visual beacons, drawing focus to key products or promotions. |
| Visual organization | Color-based grouping simplifies shopping and creates a cohesive, pleasing environment. |
Customers typically judge a product within 90 seconds of interacting with it, and about 60% to 90% of their judgment is based on color.
Lighting temperature, measured in Kelvins (K), also affects perception. Warmer light around 3000K emphasizes warmth and richness, ideal for clothing and furniture stores. Cooler light around 4000K creates a modern, energetic feel, suitable for minimal or graphic brands.
| Color Temperature | Perceived Effect | Typical Luxury Application |
|---|---|---|
| 2,700K | Intimate, warm, reinforces craft and heritage | Heritage or craft-focused luxury brands |
| 3,000K | Warm yet modern, flattering to product and customer | Professional baseline for most fashion and boutique retail |
| 4,000K | Crisp, cool, modern, energetic | Highly graphic or minimal brands |
Warmer light creates a relaxing atmosphere for clothing, linens, and furniture. Cooler light evokes cleanliness and spaciousness. However, lighting that is too warm may make customers too relaxed to buy, while lighting that is too cool may feel cold and sterile. A customized mix often works best.
Consistency matters most. Maintain the same temperature across all fixtures to deliver a coherent brand experience. Use accent lighting to highlight hero products and create depth. Combine these techniques with sign holders to guide shoppers naturally through your space.
Strategic Product Placement and Display
Where you put products and how you show them changes what people buy. Smart placement turns casual shoppers into active buyers. This part of the Store Merchandising Guide explains how to build a power wall, set up impulse zones, and use shelving systems that keep items neat and easy to see.
Building the “Power Wall” and Impulse Zones
The power wall is the main display shoppers see when they walk in. It sets the tone for the whole visit. Save this space for your top-profit items, best sellers, and new products. Use clear signs and bright lights to make these items stand out. Refresh the power wall every two to four weeks. If it stays the same too long, it stops working.
Impulse zones near the checkout catch last-minute buys. Even a small rack at the register can boost sales. Over 65% of food and drink purchases in convenience stores happen on impulse. Putting items at the checkout raises the total sale amount. About 80% of shoppers make impulse purchases, and the checkout is their last stop. Fill this zone with cheap, high-profit items. Small snacks, drinks, batteries, and phone accessories work great. These products cost little but earn a lot. Customers grab them without thinking.
Smart Shelving and Fixture Ideas
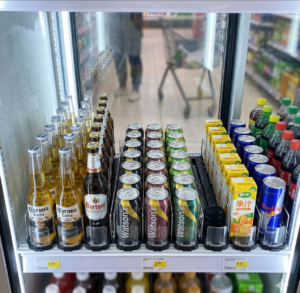
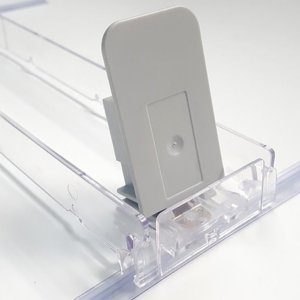
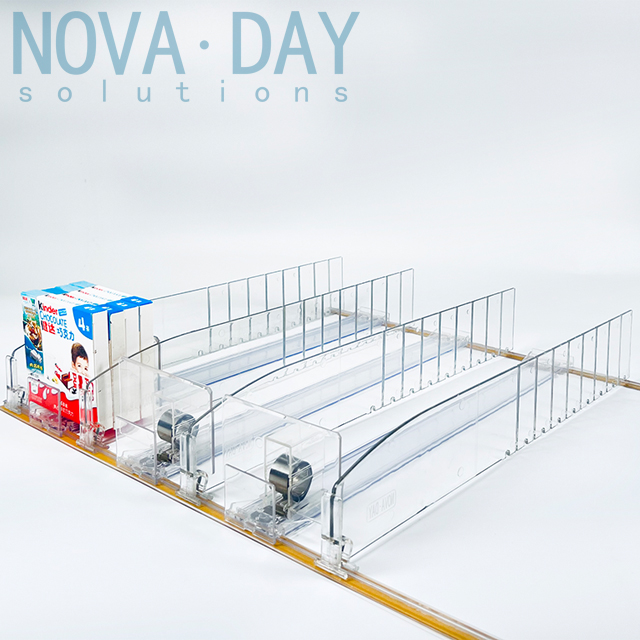
Your shelves must keep items tidy and within reach. A pusher system moves products forward automatically as shoppers take them. This keeps every item facing the front and easy to spot. It also removes the need for manual straightening.
| Task | With Pro Pusher | Without Pro Pusher |
|---|---|---|
| Shelf fronting | Automatic | Manual, frequent |
| Restocking speed | Faster bulk fill | Slow, item by item |
| Labor hours per aisle | Reduced | High |
Stores using pusher systems see sales go up by 18-22%. Better visibility and fewer empty spots drive this gain. The system also cuts restocking labor costs by 40%.
Automation saves a significant amount of time. With a 40% reduction in restocking labor, workers can spend less time on shelf maintenance and more on customer service and stock control.
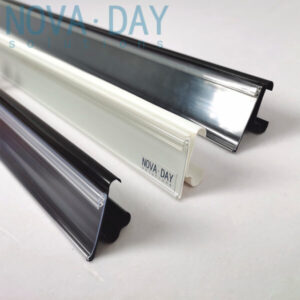
Shelf tools such as dividers and data strips keep displays clean and organized. They stop empty spots from showing. The system is built tough and works in both normal and cold storage. You can customize everything. Pick sizes, colors, and designs that match your brand. This Store Merchandising Guide suggests buying automated shelving from day one. The upfront cost pays off through lower labor bills and higher sales.
Seasonal and Promotional Merchandising
Seasonal displays can boost sales, but only if you plan them early. Waiting until the week before a holiday means you lose money. This Store Merchandising Guide shows you how to build a calendar and run promotions that turn foot traffic into sales.
Planning a Seasonal Merchandising Calendar
Start your calendar well in advance. Map every major shopping period for your store type. The table below shows key periods that matter for most retailers.
| Key Date/Period | Event/Season | Supporting Details |
|---|---|---|
| Summer | Summer Shopping Period | Father’s Day, July 4th sales, Amazon Prime Day |
| Back-to-School Season | Back-to-School Season | Major shopping period |
| Late August | Back-to-College Season | Peak period for college essentials |
| November 1 – December 31 | Q4 Holiday Season | Black Friday, Cyber Monday, Christmas, Boxing Day |
| December 19-24 | Last-Minute Shopping Window | Super Saturday and final week before Christmas |
Mark these dates on your master calendar. Work backward from each peak date to plan ordering, display setup, and staff training. Order seasonal stock early. Build displays in advance of the event. This timing keeps you ahead of demand instead of chasing it.
Executing Successful In-Store Promotions
Promotions need more than discounts. You need tactics that bring people through your doors. Consider these proven approaches:
- BOPIS conversion boost: A significant portion of shoppers who buy online and pick up in store make extra purchases during pickup.
- Loyalty program impact: Many consumers are more likely to spend with brands that offer loyalty programs.
Host in-store events and workshops. Product demos, DIY classes, and expert Q&A sessions give customers a clear reason to visit. These events create urgency and excitement. They make your store a community hub and help during slow seasons when shoppers lack motivation.
During busy seasons, protect high-value items. Use anti-theft display hooks for electronics, tools, and accessories. These hooks secure products while keeping them visible. You lower theft risk without hiding your merchandise.
Measure every promotion. Track daily sales, foot traffic, and conversion rates during the campaign. Compare these numbers to your baseline. If a promotion underperforms, adjust your approach. Try different product placement, signage, or pricing. Continuous refinement turns seasonal promotions into reliable revenue drivers.
Measuring Merchandising Performance
You can’t improve what you don’t measure. This part of the Store Merchandising Guide explains which numbers matter and how to use them for better decisions.
Tracking Key Performance Indicators (KPIs)
KPIs turn guesswork into a clear plan. Sales per square foot shows how well you use floor space. Inventory turnover tells you if stock moves fast enough. Conversion rate shows how many visitors actually buy something.
For a new store’s first three months, focus on these key numbers:
| KPI Category | Critical KPI | Why It Matters |
|---|---|---|
| Sales Performance | Sales per Transaction | Shows if displays boost extra and impulse buys |
| Conversion & Traffic | Conversion Rate | Measures how layout turns visitors into buyers |
| Visual & Display | Planogram Compliance Rate | Ensures your team set up the design correctly |
| Inventory & Stock | Stock Availability | Confirms featured products stay on shelves |
| Customer Experience | Customer Satisfaction / NPS | Captures how people feel about your store |
Moving high-selling categories to the back of the store can boost foot traffic and sales in weaker areas, improving overall store performance.
Using Data to Refine Your Strategy
POS data gives you more than just sales totals. It shows which products sell best, when they sell, and where they sit. A great product hidden in a low-traffic spot wastes its potential. Weak items taking up prime shelf space cost you money.
POS data gives past sales numbers, but it doesn’t show how product placement affects impulse buys. Retailers who treat planograms as fixed layouts miss out on changing sales trends.
Follow these steps to improve your displays:
- Calculate sales per square foot for each section using POS data.
- Group products by performance using profit margin and inventory turnover.
- Adjust planograms to move top sellers to eye-level spots or end caps.
- Check results after each change and do regular audits.
For example, a store that improved its layout and product placement saw a significant increase in sales per square foot.
Keep improving rather than aiming for perfect. Test changes, track results, and adjust. Your store grows as customer habits change.
Common Merchandising Mistakes to Avoid
Even with a solid plan, small errors can quietly drain your sales. Recognizing these common pitfalls helps you protect your investment and keep your store performing at its best.
Overcrowding and Cluttered Displays
Packing too many products onto a shelf seems efficient, but it backfires. Overcrowded displays overwhelm shoppers. They cannot find what they need, so they leave without buying. Cluttered shelves also look messy and cheap, which hurts your brand image.
When customers face too many choices, they often choose nothing at all. This decision fatigue reduces sales and frustrates shoppers. You lose repeat business because people remember the stress, not the products.
POS accessories such as shelf data strips and dividers solve this problem. Shelf data strips keep product information organized and readable. Dividers create clear boundaries between items, so each product gets its own space. These tools maintain clean, front-facing displays without constant manual effort. Your shelves stay tidy, and customers find what they need quickly.
Ignoring the “Golden Zone” and Sight Lines
The golden zone is the shelf area at eye level, roughly 50 to 65 inches from the floor for average adults. Products placed here get the most attention. Ignoring this zone means your best items sit unseen.
The data shows eye-level products get the highest visibility. However, purchase likelihood varies by product and placement. You should test different placements for different products.
Demographics also matter. The optimal height range may vary based on customer height. For example, senior-focused stores may benefit from slightly lower shelves.
Products in low-traffic zones or corner shelves become invisible unless shoppers search for them. This Store Merchandising Guide recommends using shelf dividers and data strips to keep displays organized and ensure your golden zone stays stocked and easy to read.
Successful merchandising blends planning, execution, and refinement. Professional visual merchandising reflects your brand identity, engages shoppers, and grows sales. Leverage pusher systems and POP pricing to boost visibility and efficiency. Implement these strategies today. View your store as a dynamic space that evolves with customer needs. Explore product ranges from suppliers or consult a professional visual merchandiser for further assistance.
FAQ
How often should I update my store displays?
Refresh window displays and the power wall regularly. Seasonal changes require earlier planning. Regular updates keep repeat customers engaged and prevent displays from becoming invisible.
What is the ideal height for product placement?
Place your best-selling items at eye level, roughly 50 to 65 inches from the floor. This golden zone receives the most attention. Adjust heights based on your customer demographics.
How do I measure merchandising success?
Track sales per square foot. Use POS data to identify underperforming areas and adjust your displays accordingly.