Beverage shelf optimization means using every inch of your small store wisely. You focus on high-profit, top-selling SKUs, use vertical space, and match your shelves to shopper traffic patterns. Every facing counts in a small format. One bad shelf decision directly hurts your revenue, while one smart change can lift it.
You do not need a big budget or a large team to improve your beverage set. You need a clear method. This guide shows you how to check your space, pick the right product mix, and set up shelves for maximum impact. You will also learn to display products visually and measure your results.
Key Takeaways
- Check how much shelf space you have and count each facing to use every inch well.
- Put the drinks that sell the most at eye level and in busy areas to boost sales.
- Pay attention to the top 20% of products that make up 80% of your beverage sales.
- Use gravity feed systems to keep shelves neat and cut down on restocking time.
- Look at your planogram every three months and watch your sales to change your plan.
Space Constraints in Small Stores
Linear Feet and Dead Zones
You start by measuring your beverage set in linear feet. Pull out a tape measure and record the width of each shelf or cooler section. Then count the facings—the number of product fronts a shopper can see. A 6-foot cooler can hold 12 facings of 16-oz bottles. That simple count tells you how much selling space you truly have.
Dead zones waste that space. Bottom corners and the far ends of aisles get less attention. Shoppers often skip these spots. You can fix this by moving slower-selling or bulk items there. Keep your best sellers in high-traffic areas.
Mapping Shopper Traffic
Watch how people move through your store. Study the route shoppers follow from the entrance to the register. High-visibility zones near the entrance or visible from outside are prime spots. Place new, premium, or high-margin drinks there. A rotating display with eye-catching visuals can stop shoppers immediately.
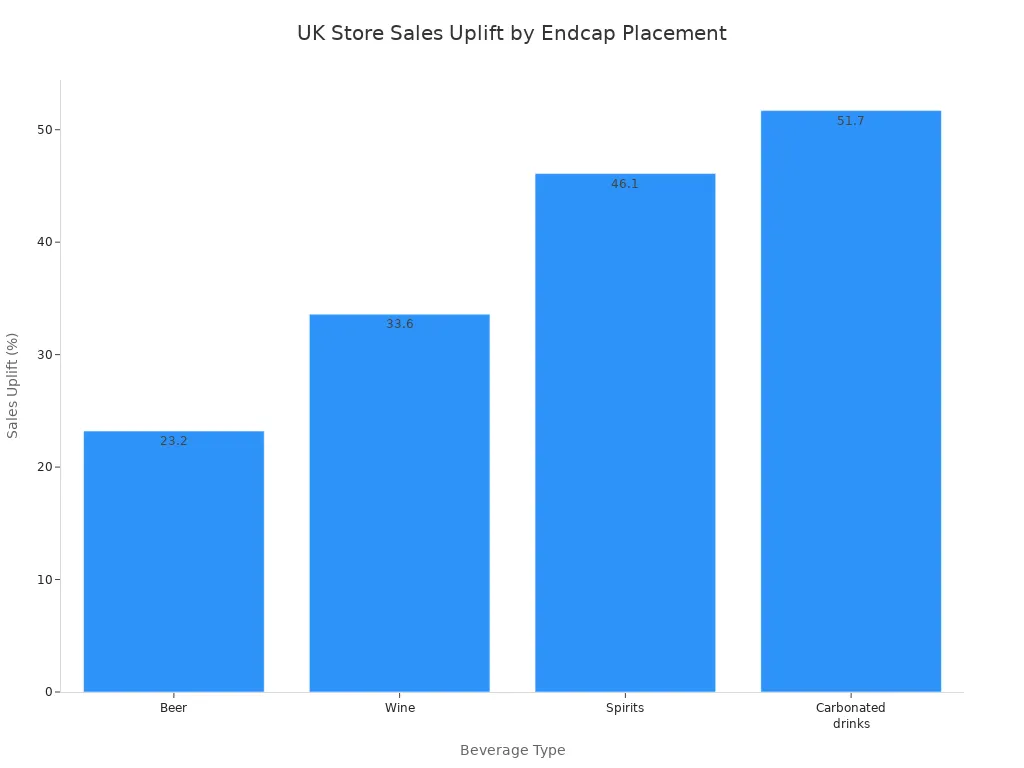
Endcap placement matters too. Research from UK stores shows beer sales rose 23.2% and carbonated drinks jumped 51.7% when moved to endcaps. Rear endcaps often outperform front ones. In one Australian grocery experiment, rear endcap placement produced a 416% sales uplift. Front endcaps still delivered a 346% uplift. These numbers show the power of smart placement.
Traffic patterns also affect shelf height. A laboratory study found junk food at eye level received more visual attention than items on higher or lower shelves. Place high-margin beverages at eye level for adults. Keep value items below and premium products above. This top-to-bottom logic guides shoppers naturally.
Beverage Shelf Optimization and Product Mix
Core vs. Seasonal Beverages
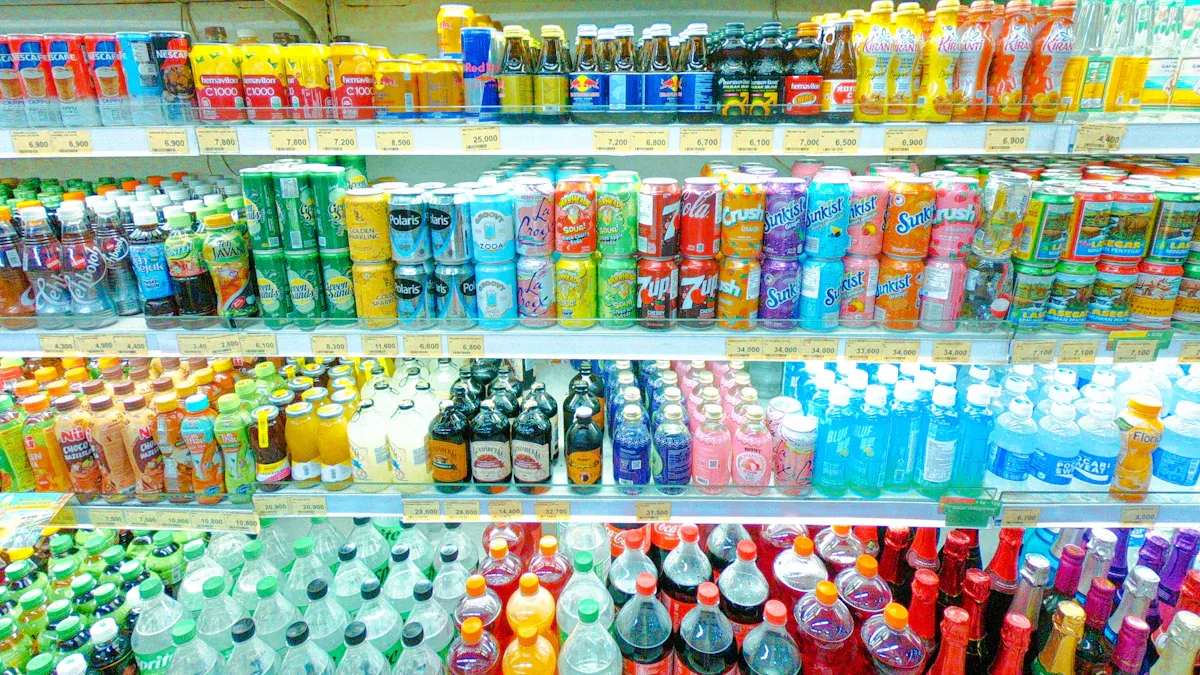
Your drink shelf should have two types: core products and seasonal items. Core drinks sell all year. Water, soda, energy drinks, and popular sports drinks are examples. They get permanent shelf space because customers look for them every time. Seasonal drinks sell well only at certain times. Hot drinks are big in winter. Sports drinks and frozen treats sell best in summer. Back-to-school time boosts energy drinks and snack sales.
You can plan these changes with a simple calendar. In January and February, put hot drinks and hand warmers near the entrance. Place Valentine’s candy and mints at the counter. From March to April, show new energy drink flavors and sports drinks on endcaps. In summer, put sunscreen, bug spray, and sunglasses near the door. Frozen treats and sports drinks work well on endcaps. Fall brings Halloween candy and big snack bags. The holiday season is best for gift packs and fancy drinks.
Think of your stock plan as seeing patterns. Use last year’s sales numbers to know what to order now. Local weather and events are more important than the date on the calendar. A store near a school will see back-to-school sales earlier than a store near a retirement home.
Using Sales Data for Assortment
Sales reports show which items should get your limited shelf space. Get a POS margin report for each product. Sort from lowest to highest margin. This shows where you lose money. Note items below about 15% margin. Watch out for products with negative margin. That can happen from old promotions or missing price hikes. Items that sell a lot but have low profit are your biggest money leaks.
The top 20% of items usually make up 80% of sales. Find these winners and keep their shelf space. Give space based on profit per foot, not just sales. For example: wine brings in $2,000 a week at 40% margin. That’s $800 gross profit over 20 feet. That’s $40 per foot. Beer brings in $3,000 a week at 22% margin. That’s $660 profit over 40 feet. That’s $16.50 per foot. Wine gives about 2.4 times more profit per foot. This idea changes how you set up your drink shelves.
Cross-merchandising makes these results even better. Put energy drinks next to protein bars. Place matching items in busy areas or near the checkout. Use POS data to find items often bought together. This raises the average sale and gets customers to add more. It also helps sell slow items next to popular ones. What goes together matters. Forcing drinks with unrelated items rarely works as well. Build displays based on what people naturally buy together.
Shelf Layout Best Practices
Top-to-Bottom Shelf Logic
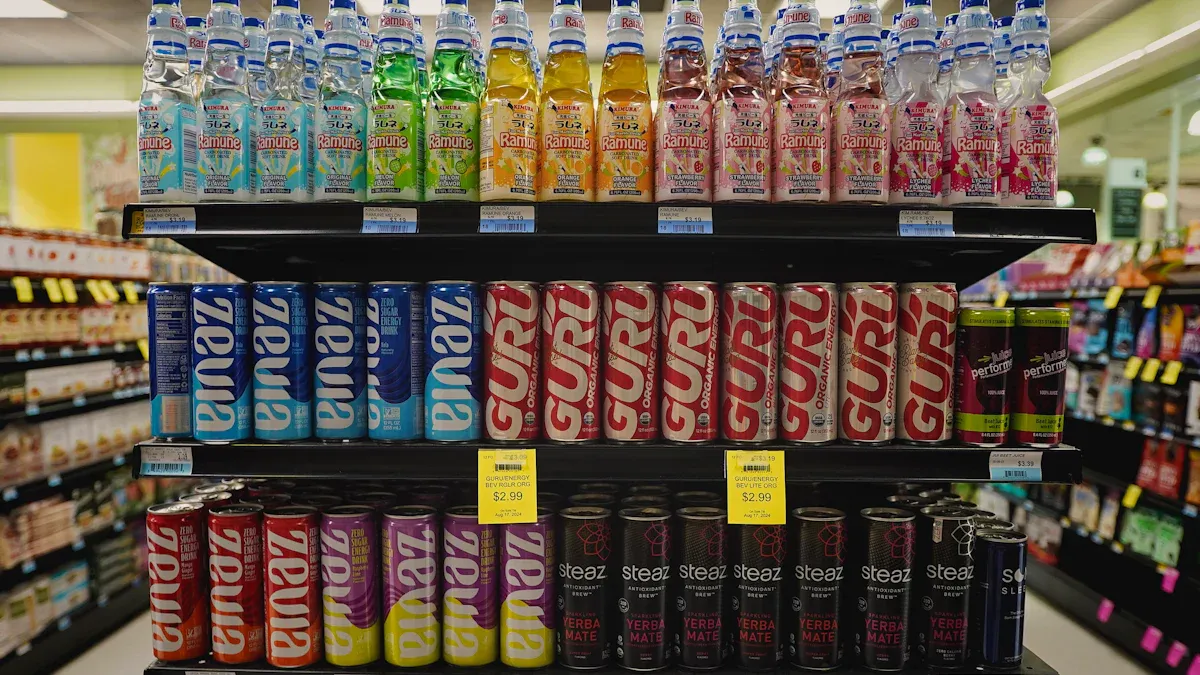
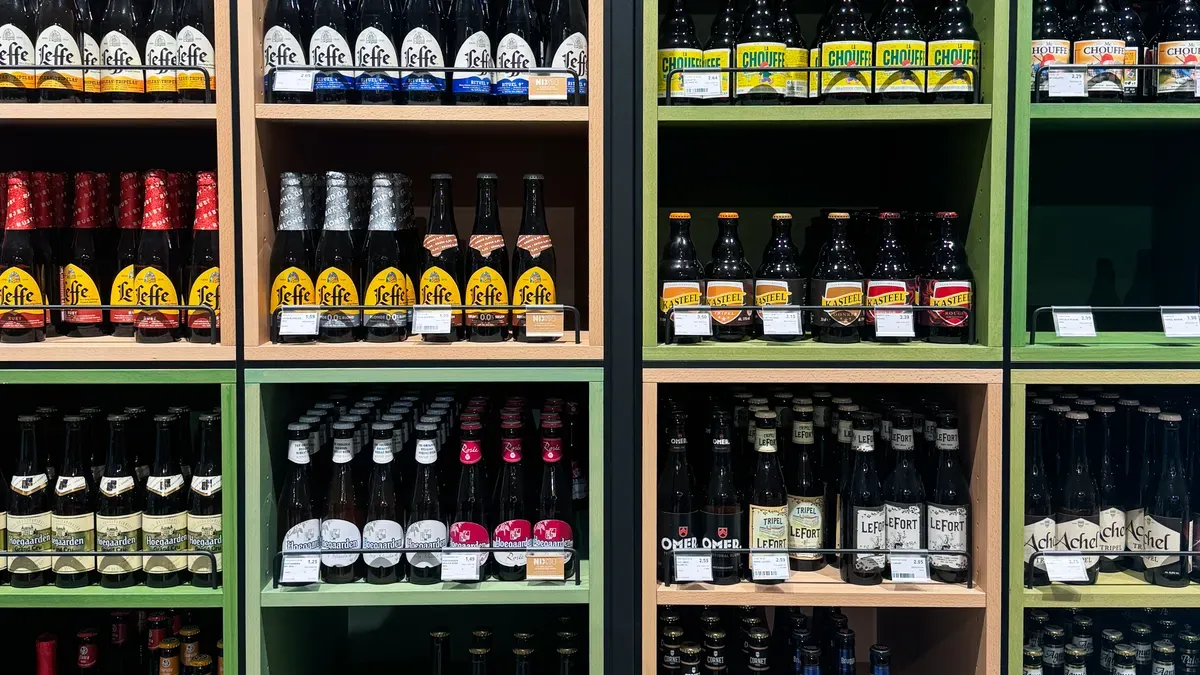
Shoppers look at shelves from top to bottom without even thinking. You can use this natural habit to guide what they pick. Put high-margin impulse items at eye level. This spot grabs attention first. Eye-level shelves in a 6-foot cooler should hold energy drinks, premium iced teas, or single-serve functional beverages. These products earn you the most profit per inch.
Set value and bulk items on lower shelves. Customers who need a 12-pack of soda or a gallon of water will bend down for them. They already know the price. They do not need visual persuasion. The lower shelf works best for family-size bottles and multi-pack cans.
Put premium or specialty drinks on the top shelf. This creates a sense of exclusivity. Shoppers see craft sodas, imported sparkling water, or organic kombucha as special finds. They reach up for them willingly. The top shelf signals quality and justifies a higher price.
This logic applies to any shelf type. Use it in open shelves, refrigerated coolers, and endcap displays. Match product margin with shelf height. Higher-margin items earn the best positions. Lower-margin staples take less visible space.
Category Blocking and Gravity Feed
Group similar drinks together. Place all water in one block, sodas in another, and energy drinks in their own section. This makes shopping faster. Customers find what they need without scanning the entire cooler. Category blocking also encourages cross-category purchases. A shopper looking for water notices the sparkling water next to it. They add it to their basket without planning to.
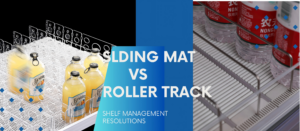
Gravity feed systems support this layout perfectly. These systems use sloped shelves or tracks. Products load from the back and slide forward as shoppers remove them. Gravity keeps items front-facing at all times. You never see empty gaps or messy rows. Staff spend less time straightening shelves. The system handles that automatically.
Gravity feed offers several practical benefits. Products stay visible and easy to reach. Staff restock faster because they load from the back without moving existing items. Inventory rotates naturally. Older products sell first, which reduces waste and spoilage. This is especially important for dairy-based drinks and refrigerated beverages.
Keep shelves organized and accessible. Gravity feed excels in this area. Its slanted design pushes products forward automatically. This means older inventory sits at the front and sells first. Staff do not need to shuffle through items during restocking. They save time and avoid overlooking old stock.
Now consider the BEVERAGE PUSHER from Nova-day. This shelf organization system works perfectly for beverages, bottles, and cans. It features a sturdy aluminum fastening rail. The rail ensures smooth sliding and secure placement on any shelf. Self-adjustable wire dividers let you change the width for different bottle sizes. You can fit glass bottles, plastic bottles, and cans in the same system.
The easy-release front lock makes restocking simple. You pull the lock, slide items forward, and lock it back. No manual adjustment needed. The system also offers two housing angles. The 90-degree vertical display works well for standard shelves. The 70-degree slanted display tilts products forward for better visibility. A slight 2-degree inclination inside the housing helps customers see and reach products easily.
Combine category blocking with these pusher trays. Place one tray for water, another for soda, and a third for energy drinks. Each tray adjusts to the specific bottle size. The dividers keep each category separate and tidy. Shoppers see a clean, organized section that invites browsing.
This layout approach supports your overall Beverage Shelf Optimization strategy. You use every shelf inch wisely. High-margin items get prime positions. Categories stay organized. Gravity feed and pusher systems keep products looking their best. The result is a beverage set that sells more with less effort.
Visual Merchandising
Color Blocking and Signage
Color blocking turns a messy drink area into an easy-to-read map. You group drinks by brand color or category shade. Put all green sparkling water together. Line up red soda labels in one row. Shoppers then find their favorite section in seconds. This simple trick cuts search time and speeds up choices.
Signs help the block without making it look cluttered. Use plenty of white space and keep text short. A clean sign reads faster than a busy one. Set a clear visual order. Make the product name the largest part. Follow it with tasting notes and details in smaller text. Keep body text to three sentences or less. Every word must earn its spot. Pick simple fonts too. One serif font for headlines and one sans-serif font for body text keeps things readable at small sizes.
Shelf Talkers and Pricing
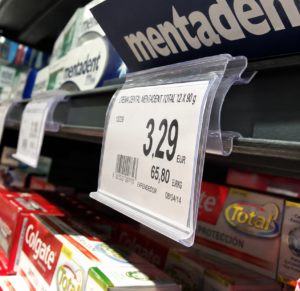
Shelf talkers guide choices right when shoppers decide. Place small shelf signs near the product. Shoppers then read prices and features up close. This placement adds no visual clutter to the display. A talker that says “New Flavor” or “2 for $5” answers the shopper’s question right away.
Keep your talkers the same across the whole drink section. Use the same size, font, and color scheme. Consistency builds trust and makes prices easy to compare. Update talkers whenever prices change. Old signs confuse customers and cause checkout disputes. A simple system works best. Print talkers on plain card stock. Slide them into shelf edge holders. Check them during every restocking cycle. Remove damaged or outdated signs right away. This habit keeps your display sharp and your pricing honest.
Execution and Measurement
Planograms and Restocking
A planogram is a simple map of your drink shelf. It shows where each product goes and how many facings it gets. You make one planogram for each cooler or shelf area. Then you follow it every time you restock. This keeps your shelves steady and well organized.
Check your planograms on a regular schedule.
Most c-store planograms should be checked at least every three months. Update them when seasons change, a new promotion starts, best-selling SKUs change, or the store gets remodeled.
A big category review works well every 12–26 weeks. Weekly reviews handle small changes like new products and items being removed.
How often you restock depends on your sales volume. Busy coolers may need restocking every day. Slower sections can wait two or three days. The Nova-day BEVERAGE PUSHER makes this job easier. Its easy-release front lock lets staff slide and move the pusher without manual adjustment during restocking. This saves time and keeps your shelves looking full. Nova-day also offers custom manufacturing services for retail display needs.
Tracking Sell-Through
Sell-through tracking shows which drinks earn their shelf space. Each product has a unique SKU code. You use these codes to track items coming in and going out. Scan SKUs at the register and during inventory counts. This gives you clear data on sales trends and profit margins.
Track a few key metrics each month. Sales growth rate compares current sales to earlier sales. Out-of-stock rate shows how often items run out. Sales per outlet measures total sales divided by stores visited. Order frequency counts orders per store over a period. Stock turn rate equals sales divided by average stock at retail. If you sell 600 units a month and average retail stock is 200 units, your STR is 3. That means you turn over shelf inventory 3 times a month.
Use this data to adjust your Beverage Shelf Optimization plan. Remove slow SKUs and add new ones. Watch several metrics to get a full view of store performance. Steady measurement turns shelf work into a lasting profit driver.
The single most effective move you can make is focusing on the top 20% of SKUs. These items drive 80% of your beverage sales. Give them the best shelf positions. Keep them in stock. Start small this week. Pick one cooler or shelf section. Audit it first and note what sells best. Apply just one change from this guide. Rearrange a shelf by margin. Add a gravity feed tray. Consistent measurement and regular adjustment turn this work into a lasting profit driver. Your Beverage Shelf Optimization becomes a habit. You build a system that sells more with less effort every single day. That shift pays off week after week.
FAQ
How do I know which drinks deserve the best shelf space?
Look at your sales reports. Find the top 20% of SKUs that drive 80% of your beverage sales. Give these items prime positions at eye level. Check profit per foot, not just total sales. A product with higher margin per foot earns better placement.
What is a dead zone, and how do I fix it?
Dead zones are spots shoppers ignore. Bottom corners and far ends of aisles are common examples. Move slow-selling or bulk items there. Keep your best sellers in high-traffic areas. This simple shift puts your top products where customers actually look.
Can I use gravity feed systems on any shelf?
Gravity feed works on most shelves and coolers. The BEVERAGE PUSHER from Nova-day fits glass bottles, plastic bottles, and cans. Its aluminum rail mounts with glue or clips. Self-adjustable wire dividers change width in three stages. You choose a 90-degree or 70-degree housing angle.
How often should I update my planogram?
Check your planogram at least every three months. Update it when seasons change, promotions start, or best-selling SKUs shift. A full category review works well every 12 to 26 weeks. Weekly checks handle small changes like new products or discontinued items.
What numbers should I track to measure success?
Track sales growth rate, out-of-stock rate, and stock turn rate. Stock turn rate equals sales divided by average stock at retail. If you sell 600 units monthly and hold 200 units on average, your rate is 3. Watch several metrics together for a full picture of performance.